Integrates Notion databases with Google Sheets, and generate dynamic pie charts, providing a powerful and intuitive way to visualize and analyze data.
- A Google account with access to Google Sheets and Notion account.
- A foundational understanding of Google Sheets, Google Apps Script, Notion, and Notion API.
Setup #
- Access a Sample Google Sheet: Begin by opening the Sample Google Sheet .
*Note: The samples provided are merely illustrative, showcasing personal financial management.
- Copy the Google Sheet: Make a copy of the Google Sheet to create your personalized version.
- Authorization: The first time you run the script, it will ask for your permission to access certain data. If you're using a free Gmail account, you might see a warning that says
Not Verified by Google. Don't worry about this warning - you still need to give permission for the script to work. The script is yours alone, and it won't share any data outside of Google, unless you choose to share your Google Sheet. The only data it might send outside of Google is website status codes, for monitoring purposes.
Usage #
- Notion API: Create a Notion API for integration.
- Notion Database:
- Create a database for integration. When creating a database, ensure the following columns with designated data types are set:
Item: TitleCategory: Select or RelationPay Amount: Number- Input each item record in the database.
- Integrate with Notion Api created in the first step.
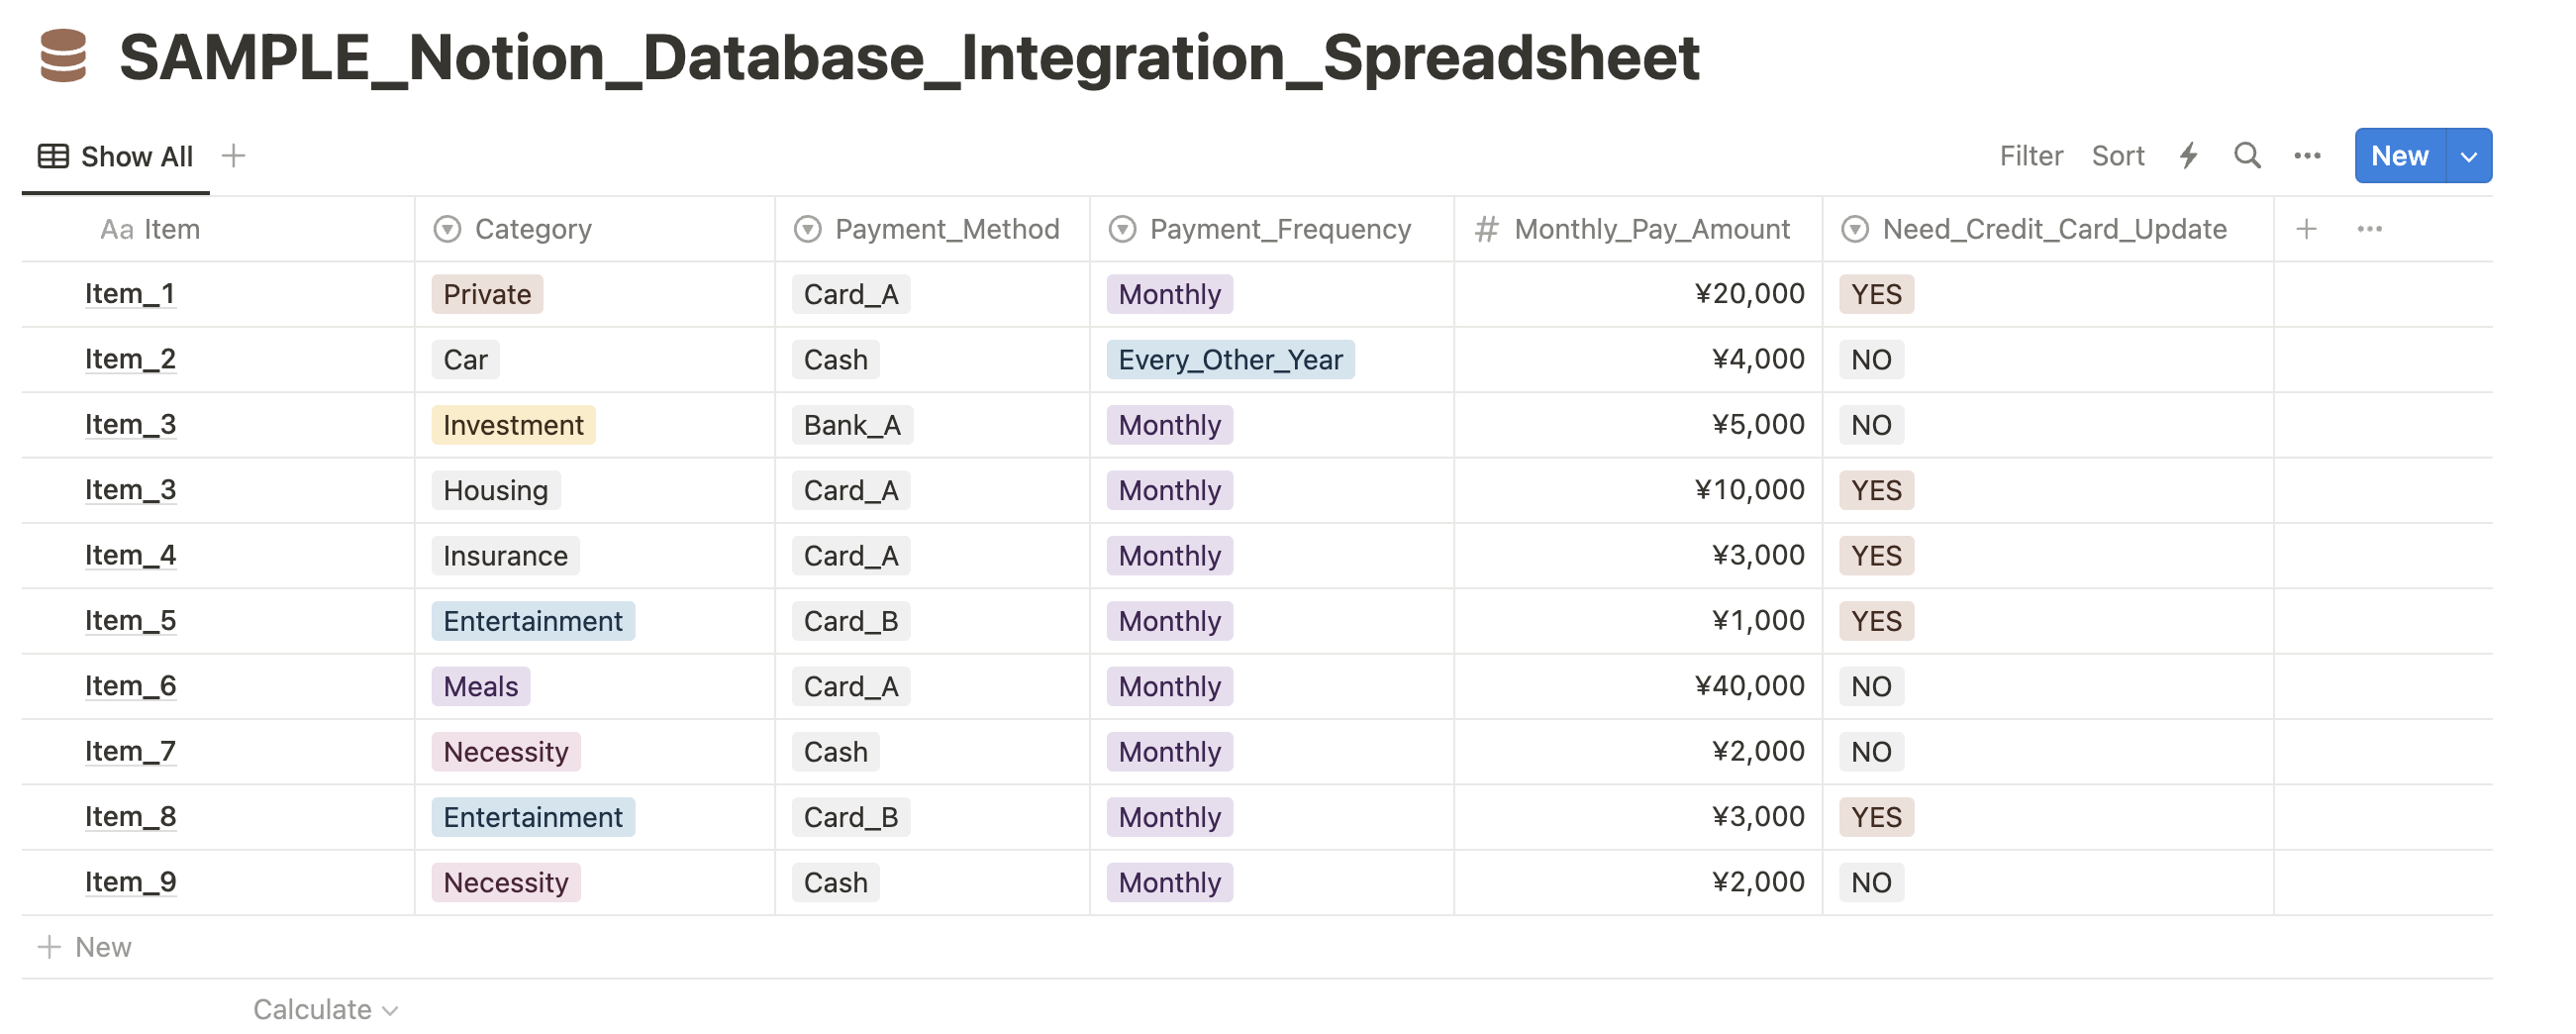
Figure: Sample Notion Database - Google Sheet:
- Create a new sheet to display record details from the Notion database.
- Navigate to Apps Script
variables.gsand set each variable.- For all databases (In creation of second or subsequent databases, skip this step):
notionToken: Notion API Secret KeysheetNameChart: Name of the sheet where pie charts are displayed. By default, it is named as "Chart"
- For each database:
tableId: ID of the target Notion databasesheetName: the name of the sheet where the record details from the target notion database are displayeditem/category/monthlyPay: Names of each field in Notion databasechartName: Name of the chart which is displayed at the top of the chart.
* When creating second or subsequent pie charts, copy the variables and change the values of each variable.
- For all databases (In creation of second or subsequent databases, skip this step):
- Create a trigger function in
codes.gs. Ensure the required parameters are included and the variable names in the parameters are consistent with those set invariables.gs. The row and column parameters can be set as desired. - Test the trigger function: Verify that the records of the target Notion database are fetched and the pie chart for the database is successfully generated.
- Set the trigger for the function: Navigate to
Triggerin Apps Script to set the trigger to fire the function. It is recommended to set the trigger as onOpen so that every time the spreadsheet is open, the pie chart is updated.
* When creating second or subsequent pie charts, copy the previous function codes and change variable names.
* You can find a sample of the spreadsheet settings from HERE .
Please note that your use of this website is subject to the Terms and Conditions.
You can find the source code for this tool on Github. Click HERE .
Last updated: May 5, 2024
NotionSheets Chart